React Developer Tools
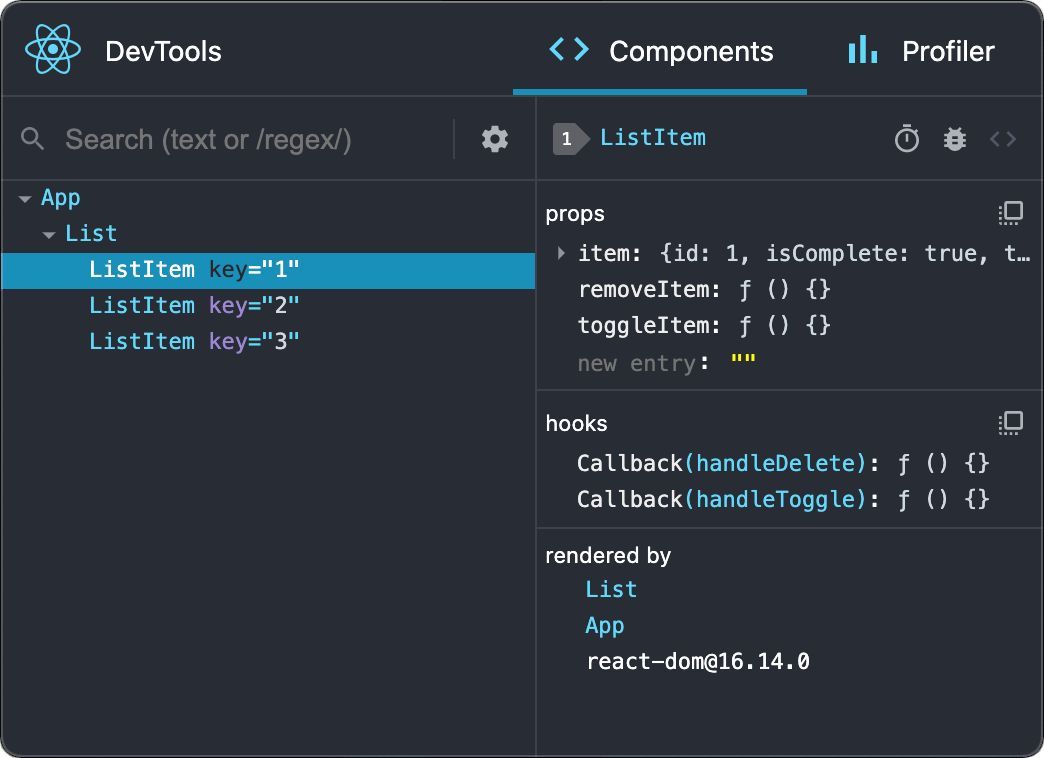
You can use the standalone version of React Developer Tools to debug the React component hierarchy. To use it, install the react-devtools package globally:
- npm
- Yarn
npm install -g react-devtools
yarn global add react-devtools
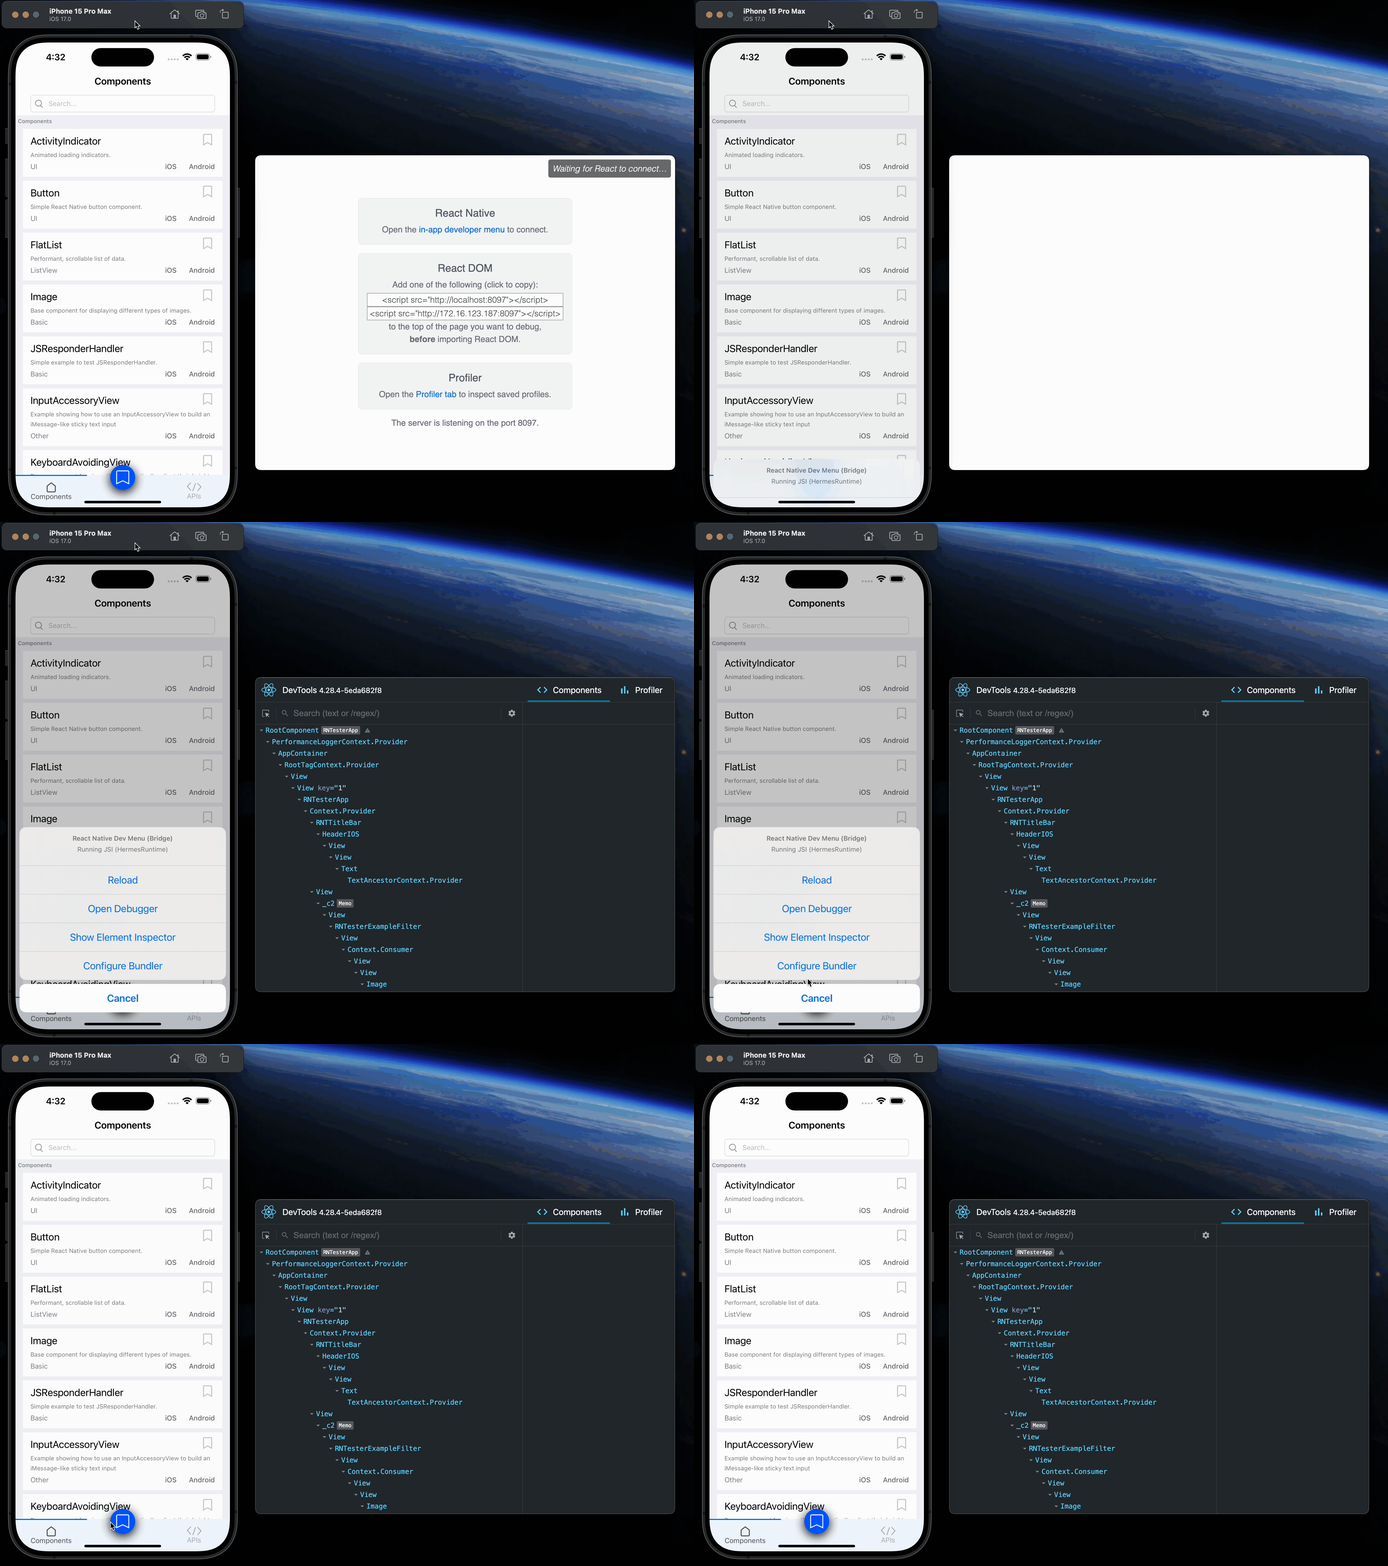
Now run react-devtools from the terminal to launch the standalone DevTools app. It should connect to your simulator within a few seconds.
react-devtools

If you prefer to avoid global installations, you can add react-devtools as a project dependency. Add the react-devtools package to your project using npm install --save-dev react-devtools, then add "react-devtools": "react-devtools" to the scripts section in your package.json, and then run npm run react-devtools from your project folder to open the DevTools.
Integration with React Native Inspector
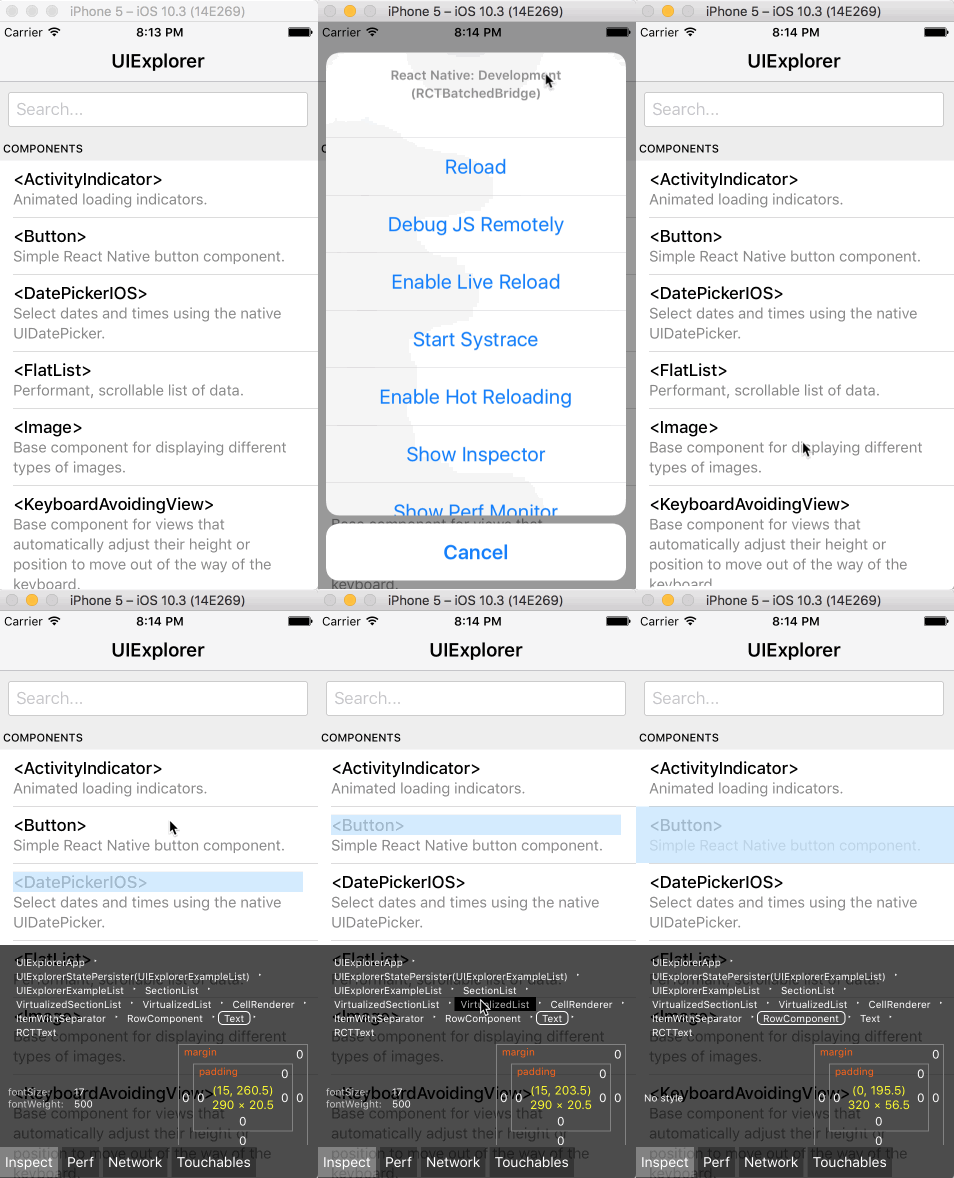
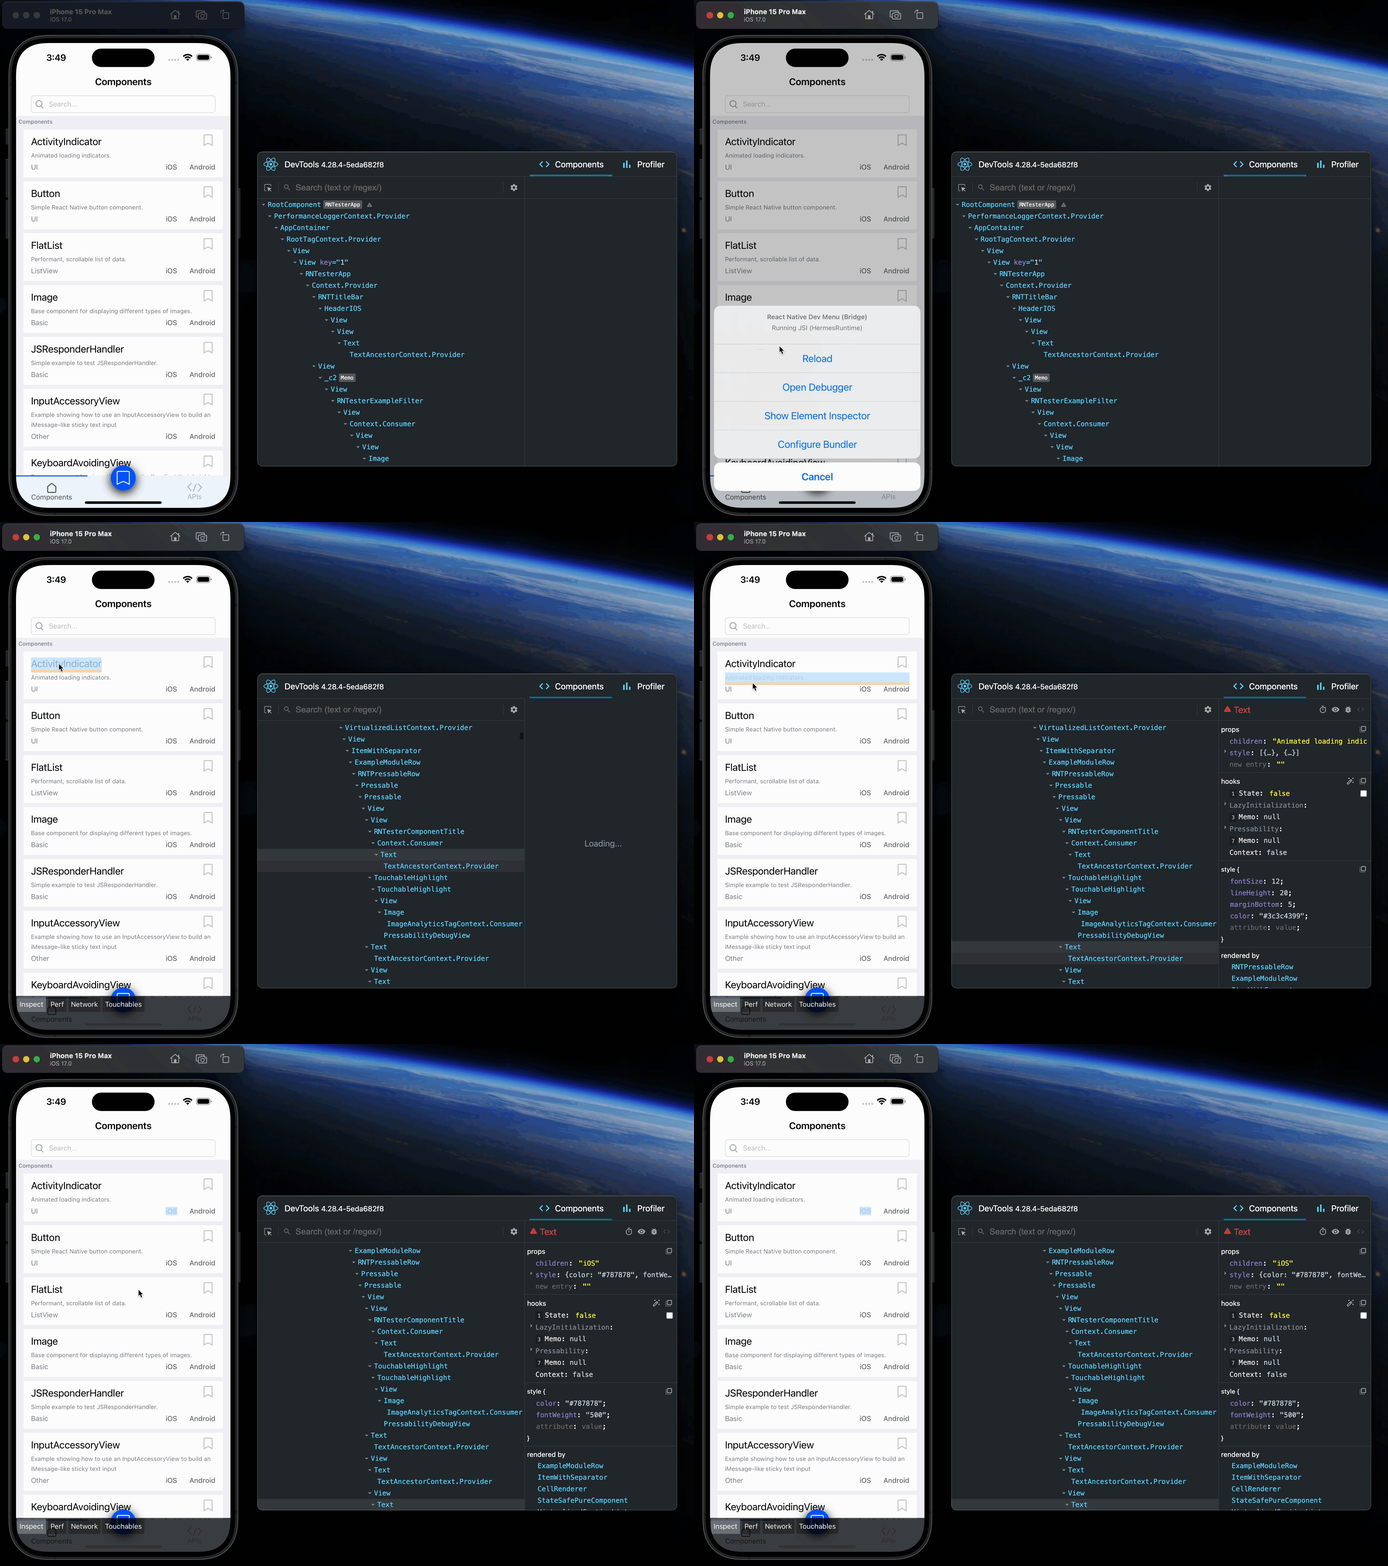
Open the Dev Menu and choose "Toggle Inspector". It will bring up an overlay that lets you tap on any UI element and see information about it:

However, when react-devtools is running, Inspector will enter a collapsed mode, and instead use the DevTools as primary UI. In this mode, clicking on something in the simulator will bring up the relevant components in the DevTools:

You can choose "Toggle Inspector" in the same menu to exit this mode.
Debugging application state
Reactotron is an open-source desktop app that allows you to inspect Redux or MobX-State-Tree application state as well as view custom logs, run custom commands such as resetting state, store and restore state snapshots, and other helpful debugging features for React Native apps.
You can view installation instructions in the README. If you're using Expo, here is an article detailing how to install on Expo.
Troubleshooting
Once you have React DevTools running, follow the instructions. If you had your application running prior to opening React DevTools, you may need to open developer menu to connect them.

If connecting to the emulator proves troublesome (especially Android 12), try running adb reverse tcp:8097 tcp:8097 in a new terminal.